Analyst Ratings Change
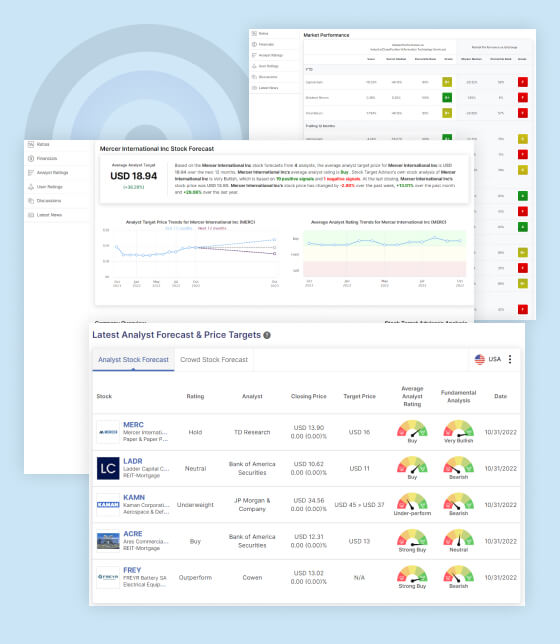
As of December 14, 2023, CIBC World Markets (Rank#9) maintains a “Neutral” rating for the Bank of Nova Scotia, with a target price of CAD 58. This rating suggests a balanced stance, indicating neither a particularly bullish nor bearish outlook for the bank’s stock. Investors may interpret this as a recommendation to hold or maintain their current positions, as per CIBC World Markets’ assessment.
Scotiabank Stock Analysis
As of the latest data available, the Bank of Nova Scotia’s stock forecast is based on the analysis of 15 analysts. The average analyst target price for the Bank of Nova Scotia over the next 12 months is CAD 65.30. This implies that, on average, analysts anticipate the stock to reach this price level in the coming year.
The average analyst rating for the Bank of Nova Scotia is categorized as “Hold.” This suggests a neutral stance among analysts, indicating that they do not strongly recommend buying or selling the stock at the current moment.
Stock Target Advisor’s own analysis of the Bank of Nova Scotia’s stock is classified as “Slightly Bearish.” This assessment is based on a combination of 3 positive signals and 7 negative signals. The mixed signals may imply a cautious or mildly pessimistic outlook on the stock.
At the last closing, the Bank of Nova Scotia’s stock price was CAD 62.08. Over recent periods, the stock has shown some volatility, with a change of +3.97% over the past week, +4.95% over the past month, and a decrease of -8.22% over the last year. Investors may consider these price movements and analyst recommendations when making decisions about the Bank of Nova Scotia’s stock.
Fundamental Analysis
Positives
- Underpriced compared to Book Value:
- The stock is currently trading at a low valuation in comparison to its book value, positioning it favorably relative to peers. However, investors are advised to scrutinize the company’s financial performance to ensure there are no specific reasons for this apparent undervaluation.
- Positive Cash Flow:
- The company has demonstrated positive total cash flow in the most recent four quarters. This is a positive indicator of the company’s ability to generate cash from its operations.
- Superior Total Returns:
- The stock has outperformed its sector peers in terms of average annual total returns over the past five years. This places it in the top quartile, indicating strong performance for investors who held the stock for at least 12 months.
Negatives
- Poor Return on Assets:
- The company’s management has delivered a return on assets below the median when compared to its peers over the most recent four quarters. This could indicate less efficient asset utilization.
- Overpriced Compared to Earnings:
- The stock is trading at a high valuation concerning its peers on a price-to-earnings basis and is above the sector median. This suggests that the stock may be relatively overvalued.
- High Volatility:
- Total returns for the company have been volatile, exceeding the median for its sector over the past five years. Investors are cautioned to assess their risk tolerance before investing in a stock with such fluctuations.
- Poor Return on Equity:
- The company’s return on equity has been below the median in the most recent four quarters compared to its industry peers, indicating potentially suboptimal use of shareholder equity.
- Low Revenue Growth:
- The stock has exhibited below-median revenue growth over the previous five years when compared to its sector. This could raise concerns about the company’s ability to increase its top line.
- Low Earnings Growth:
- Similar to revenue growth, the company has demonstrated below-median earnings growth in the previous five years relative to its sector. This may signal challenges in increasing profitability.
- Highly Leveraged:
- The company is positioned in the bottom half concerning debt-to-equity ratios when compared to its sector peers. The high leverage indicates that the company has a significant proportion of debt relative to equity, possibly driven by aggressive growth strategies. It’s advisable to check for relevant news and management statements for a more comprehensive understanding of the situation.

STA Research (StockTargetAdvisor.com) is a independent Investment Research company that specializes in stock forecasting and analysis with integrated AI, based on our platform stocktargetadvisor.com, EST 2007.


