Analyst Ratings Coverage
CIBC World Markets (Rank #9) maintained the “Outperform” rating, and 12 month target forecast of $30 per share.
Air Canada Stock Analysis
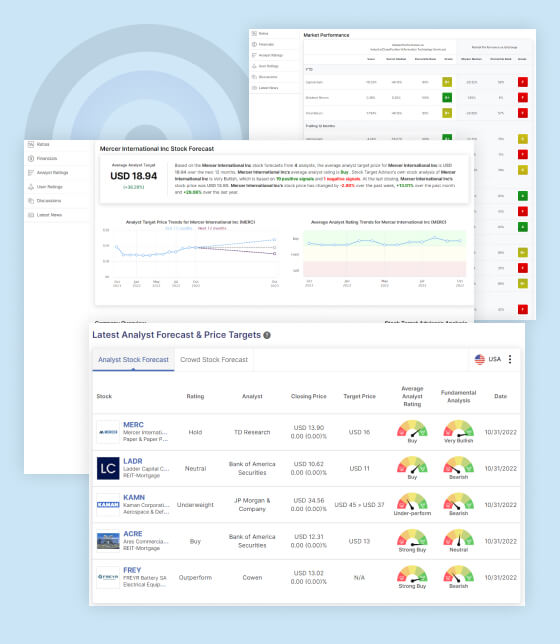
The average analyst rating for Air Canada is Buy, indicating a positive sentiment among analysts regarding the company’s future prospects. Investors often consider such ratings when making investment decisions, as they provide an overall assessment of the stock’s expected performance.
Stock Target Advisor’s analysis offers a different perspective, suggesting a Neutral stance on Air Canada. This assessment is based on a combination of 5 positive signals and 5 negative signals identified by the advisor’s proprietary analysis. Investors may want to delve deeper into these signals to understand the factors influencing this neutral rating.
As of the last closing, Air Canada’s stock was priced at CAD 17.95. Monitoring the recent performance of the stock is crucial for investors, and the provided data indicates a slight decrease of -0.11% over the past week. However, the stock has shown positive momentum over the past month, with an increase of +1.07%. Over the last year, there has been a decline of -2.97%, reflecting the challenges or fluctuations the company may have faced during that period.
Air Canada Fundamental Analysis
What to Like:
- Underpriced on Cashflow Basis: The stock is deemed underpriced when evaluating its price in relation to its cash flow compared to industry peers. This suggests that, from a cash flow perspective, the stock may be undervalued. However, it’s crucial to conduct a thorough analysis of the company’s financial performance to ensure there are no specific reasons for this apparent underpricing.
- Positive Cash Flow: The company has demonstrated positive total cash flow in the most recent four quarters. Positive cash flow is a positive indicator as it signifies the company’s ability to generate more cash than it spends, which can be essential for operational stability and growth.
- Positive Free Cash Flow: The company has reported positive total free cash flow in the most recent four quarters. Free cash flow is the cash generated by the business that is available for distribution to investors or for reinvestment in the company. Positive free cash flow is generally seen as a healthy sign for a company.
- High Market Capitalization: The company boasts a high market capitalization, positioning it as one of the largest entities in its sector and placing it in the top quartile. Larger companies often exhibit more stability and resilience, which can be appealing to investors.
- Underpriced Compared to Earnings: The stock is trading at a low price compared to its peers on a price-to-earnings basis and is in the top quartile. Similar to the cash flow perspective, this suggests that the stock may be undervalued concerning its earnings. However, caution is advised, and a thorough examination of the company’s financial health is recommended.
What Not to Like:
- Poor Return on Assets: The company has delivered below median return on assets in the most recent four quarters compared to its peers. A low return on assets may indicate inefficient use of assets to generate profits, and investors may want to scrutinize the reasons behind this performance.
- Overpriced Compared to Book Value: The stock is trading high compared to its peers’ median on a price-to-book value basis. This could imply that the market values the company’s assets at a premium, and investors should assess whether this premium is justified based on the company’s fundamentals.
- Below Median Dividend Returns: The company’s average income yield over the past five years has been low compared to its peers. This might be a concern for income-seeking investors, although it may not be a problem for those not primarily focused on dividends.
- High Volatility: Total returns for this company have been volatile and above median for its sector over the past five years. High volatility may indicate greater risk, and investors should ensure they have the risk tolerance necessary for investing in such a stock.
- Poor Risk-Adjusted Returns: The company is delivering below median risk-adjusted returns compared to its peers. Even if the company is outperforming on returns, the unpredictability of those returns suggests caution is warranted. Investors should carefully assess the risk-return profile of the investment.


