The Italian carmaker, Ferrari, predicts an adjusted EBITDA of up to €2.18 billion ($2.4 billion) for the year, surpassing their prior estimate of €2 billion. This was confirmed by their fourth-quarter adjusted EBITDA of €469 million, which exceeded analyst predictions. The demand for high-margin models such as the new €390,000 Purosangue and hybrid models is driving their success.
CEO Benedetto Vigna stated that despite a challenging global environment, they remain confident in the company’s future with “persistently high demand for our products worldwide.” Last year, Ferrari’s (NYE:RACE) unit sales increased by almost 20%, with the strongest growth in China and the Americas.
The automaker raised prices on some models, taking advantage of wealthy consumers unaffected by inflation and interest rates. They are also preparing for the transition to electric vehicles and converting their northern Italian factory into a battery-powered car hub. The first all-electric Ferrari is expected in 2025, with battery-only and plug-in hybrids expected to lead their portfolio in the latter half of the decade. Ferrari projects a revenue of €5.7 billion in 2023. Their shares have risen 17% this year.
Stock Analysis for Ferrari NV:
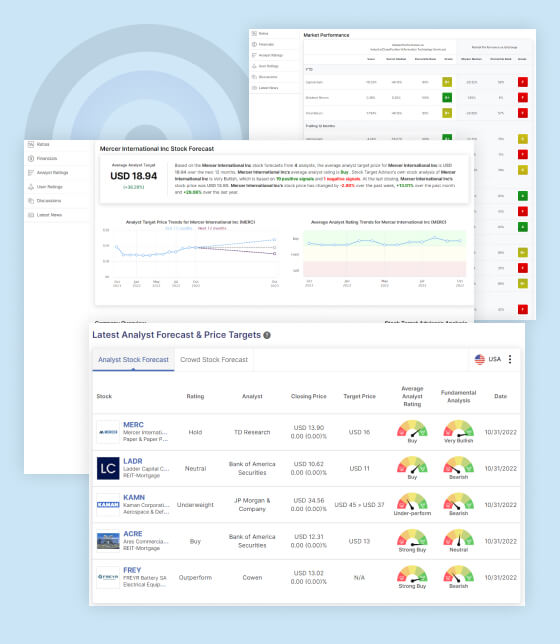
Eight analysts have issued ratings for Ferrari NV, with a consensus rating of “Buy.” The average price objective for Ferrari NV for the next 12 months is USD 257.94. The consensus recommendation among financial experts regarding Ferrari NV is a Strong Buy. Based on 11 positive signs and 6 negative signals, Stock Target Advisor rates Ferrari NV as a Slightly Bullish stock. The stock price of Ferrari NV was USD 253.32 at the market close of business on Tuesday. The share price of Ferrari NV has moved by +7.74% in the past week, +39.10% in the past month, and +6.25% in the last year.
What we like:
Low degree of instability
When compared to other companies in its industry, the stock has consistently provided superior returns over the course of a year, placing it in the top 25%. Remember that steadiness, while beneficial, can reduce your profits.
Extensive profit margin
In each of the last four quarters, the company’s management has increased the return on equity at a rate that places it in the top quartile in its industry.
Extraordinary return on investment
Over the past four quarters, the company’s management has generated a higher return on invested capital than its competitors.
Better than average rate of return
In each of the last four quarters, the company’s management has increased its return on assets, placing it in the top 25% of its industry.
Profitable cash flow
In each of the past four quarters, the company has posted net cash inflow.
Profitable free cash flow
All four quarters in the most recent year saw a positive total free cash flow for the organisation.
Excellent Profit Increase
When comparing earnings growth over the past 5 years to the rest of the sector, this stock is in the top 25%.
Excellent Sales Expansion
Compared to other companies in its industry, this stock’s revenue growth over the past five years ranks in the top quartile.
Exceptional Dividend Increases
When compared to other companies in its industry, this stock’s dividend increase over the last five years ranks among the highest.
Large Ratio of Gross Profit to Total Assets
When compared to its industry rivals, this stock’s Gross Profit to Asset Ratio ranks in the top 25%. Long-term superior returns are demonstrated, making this a popular metric among value investors.
What we don’t like:
Below-average total returns
On an annualised basis during the previous five years, the company’s performance has lagged below that of its competitors.
When compared to profits, the price is too high.
Based on a price-to-earnings ratio, the stock is trading at a premium compared to its competitors and the industry median.
Excessive in price relative to its book value.
In terms of price to book value, the stock is trading at a premium over its peers’ median.
Cash-flow valuation: too high
When compared to similar companies, the stock is selling at a premium to its peers on a price-to-cash-flow ratio. Its price tag is more than average for its industry. If you’re thinking about making a purchase, proceed with caution.
Extremely indebted
When compared to its industry counterparts, the firm has a debt-to-equity ratio that places it in the bottom half. However, it is important to keep up with the news and examine its sector and management remarks. This can be high if the company is actively striving to expand.
When considering free cash flow, the price is too high.
On a price-to-free-cash-flow basis, the stock is selling for a premium to its competitors. Its price tag is more than average for its industry. If you’re thinking about making a purchase, proceed with caution.
FA Score (Fundamental Analysis):
The fundamental analysis of Ferrari’s stock is “Slightly Bullish” with a FA score of 6.5 out of 10, where 10 is very bullish.

STA Research (StockTargetAdvisor.com) is a independent Investment Research company that specializes in stock forecasting and analysis with integrated AI, based on our platform stocktargetadvisor.com, EST 2007.


