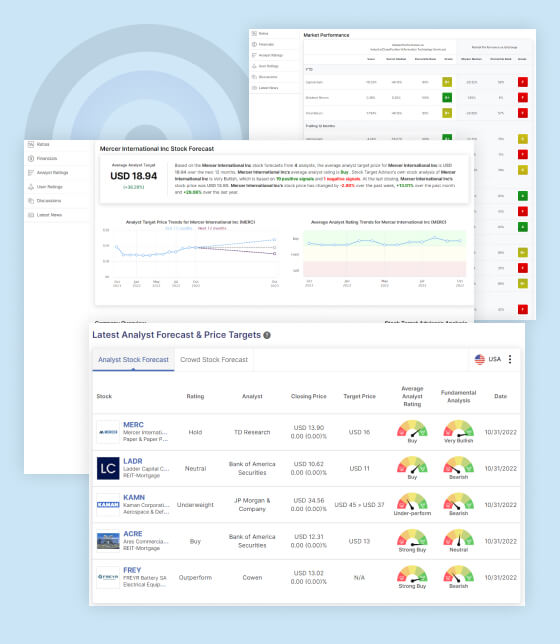
Nike Stock Forecast and Analysis
Based on the stock forecasts from 30 analysts, the average target price for Nike Inc is USD 120.76 over the next 12 months.
The average analyst rating for Nike Inc is a “Strong Buy”, which means that on average the analysts believe that the stock is a good investment and will almost definitely increase in value. Stock Target Advisor’s own stock analysis of Nike Inc is “Slightly Bullish”, which is based on 8 positive signals and 6 negative signals.
At the last closing, Nike Inc’s stock price was USD 127.94. The stock price has changed by +5.55% over the past week, +16.93% over the past month, and -14.88% over the last year.
Analyst Coverage Change:
HSBC Securities have maintained their “Hold” rating on Nike Inc., meaning that they believe the stock is currently fairly valued and that investors should hold onto their shares rather than buying or selling. However, they have also raised their target price for the stock from $100 to $125.
Positive Fundamentals of NKE’s Stock
- High market capitalization: The company has a large market capitalization, which means it has a high value in terms of its stock price multiplied by the number of shares outstanding. This can indicate that the company is well-established and financially stable, and is among the top quartile of companies in its sector in terms of market capitalization.
- Superior risk-adjusted returns: The company has performed well on a risk-adjusted basis, meaning that its returns are high when considering the amount of risk taken on by the company. This is compared to its peers in the sector, for a holding period of at least 12 months, and is in the top quartile.
- Low volatility: The company’s annual returns have been stable and consistent when compared to its peers in the sector, for a holding period of at least 12 months, and is in the top quartile. This suggests that the stock price has not fluctuated as much as other stocks in the sector.
- Superior return on equity (ROE): The company management has delivered a better return on equity in the most recent 4 quarters than its peers, placing it in the top quartile. This measure indicates how well a company is using its shareholders’ equity to generate profits.
- Superior capital utilization: The company management has delivered better return on invested capital in the most recent 4 quarters than its peers, placing it in the top quartile. This measure indicates how well a company is using its invested capital to generate profits.
- Superior return on assets (ROA): The company management has delivered better return on assets in the most recent 4 quarters than its peers, placing it in the top quartile. This measure indicates how well a company is using its assets to generate profits.
- Positive cash flow: The company had positive total cash flow in the most recent four quarters. This means the company is generating more cash than it is spending, indicating good financial health.
- Positive free cash flow: The company had positive total free cash flow in the most recent four quarters. This means the company is generating more cash from its operations than it is spending on capital expenditures, indicating good financial health and strong ability to invest in growth opportunities.
Negative Fundamentals of NKE’s Stock
- Below median total returns: The company has underperformed its peers in terms of annual average total returns in the past 5 years. This means that the company’s stock has not performed as well as other stocks in the sector over the past 5 years.
- Overpriced compared to earnings: The stock is trading high compared to its peers on a price to earning basis, and is above the sector median. This suggests that the stock may be overvalued, and not a good value for the earnings it generates.
- Overpriced compared to book value: The stock is trading high compared to its peers median on a price to book value basis. This suggests that the stock may be overvalued, and not a good value for the assets it holds.
- Overpriced on cash flow basis: The stock is trading high compared to its peers on a price to cash flow basis. It is priced above the median for its sectors. This suggests that the stock may be overvalued, and not a good value for the cash it generates.
- Overpriced on free cash flow basis: The stock is trading high compared to its peers on a price to free cash flow basis. It is priced above the median for its sectors. This suggests that the stock may be overvalued, and not a good value for the cash it generates after accounting for capital expenditures.
- Low Dividend Growth: This stock has shown below median dividend growth in the previous 5 years compared to its sector. This means that the dividends paid by the company have not increased as much as other companies in the sector over the past 5 years.

STA Research (StockTargetAdvisor.com) is a independent Investment Research company that specializes in stock forecasting and analysis with integrated AI, based on our platform stocktargetadvisor.com, EST 2007.


