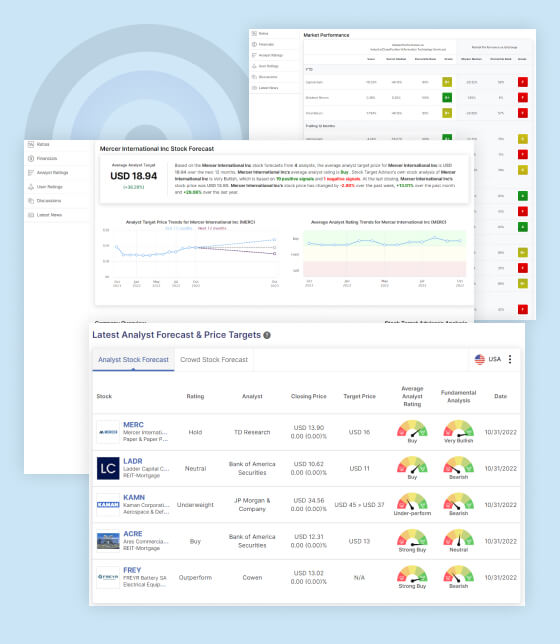
Laurentian Bank Analyst Rating Coverage:
CIBC World Markets (Analyst Rank #10 of #349) on August 31st issued a research report on Laurentian Bank’s stock, and reiterated the “Outperform” rating on the stock. The analyst also maintained the 12 month target forecast of $54 per share on the stock.
LB Stock Forecast & Analysis
Analyst Target Price and Rating
Drawing insights from 10 analysts’ forecasts, the average analyst target price for Laurentian Bank of Canada over the upcoming 12 months stands at CAD 41.43. This projected target price serves as a beacon for investors, providing an estimated future value for the stock. Moreover, Laurentian Bank of Canada benefits from an average analyst rating of ‘Buy’. This rating signifies a consensus view among analysts that the bank’s stock is well-positioned for potential growth.
Stock Target Advisor’s Interpretation
While analyst predictions are significant, a comprehensive analysis also involves considering insights from independent analysis platforms. Stock Target Advisor offers an interesting perspective, indicating a ‘Slightly Bearish’ stance for Laurentian Bank of Canada. This analysis draws on 4 positive signals and 9 negative signals, culminating in a nuanced perspective. Positive signals may include factors like favorable financial ratios, growth prospects, or market trends. Conversely, negative signals could arise from market volatility, industry challenges, or broader economic conditions.
Recent Market Performance
A snapshot of Laurentian Bank of Canada’s recent market performance offers insight into its present status. The bank’s stock price at the last closing was CAD 38.12. Over the past week, the stock experienced a decrease of -2.93%, reflecting short-term market fluctuations. Similarly, over the past month, the stock price has decreased by -7.14%, possibly echoing broader market trends or investor sentiment. Over a longer horizon, the stock has seen a decrease of -4.99% over the last year, influenced by shifts in market dynamics and economic conditions.
Fundamental Analysis
Positive Fundamentals
1. Underpriced Compared to Book Value: The stock is trading at a lower price-to-book value compared to its peers, placing it in the top quartile. This suggests that the stock might be undervalued. However, it’s essential to assess the company’s financial performance to ensure there are no specific reasons for the lower valuation.
2. Positive Cash Flow: The company has demonstrated positive total cash flow over the most recent four quarters. This indicates that the company is generating more cash than it is spending, which is a positive sign of financial stability.
3. Superior Total Returns: The stock has outperformed its sector peers in terms of average annual total returns over the past five years (considering a hold period of at least 12 months), positioning it in the top quartile. This suggests that the stock has the potential for strong long-term performance.
4. Superior Dividend Growth: The stock has exhibited top-quartile dividend growth over the past five years compared to its sector. This is appealing for investors seeking income and long-term stability.
Negative Fundamentals
1. Poor Return on Assets: The company’s management has delivered below-median return on assets over the most recent four quarters compared to its peers. This suggests inefficiency in utilizing assets to generate profits.
2. Overpriced Compared to Earnings: The stock is trading at a higher price-to-earnings ratio compared to its peers and is above the sector median. This might indicate that the stock is overvalued based on its earnings potential.
3. Below Median Dividend Returns: The company’s average income yield over the past five years has been low compared to its peers. While this might not be a concern for investors not seeking income, it’s worth considering if dividends are an important part of your investment strategy.
4. Poor Risk Adjusted Returns: The company’s risk-adjusted returns are below the median when compared to its peers. This indicates that while the company might be delivering higher returns, those returns are less predictable and could come with increased risk.
5. Low Market Capitalization: The company falls among the smaller entities in its sector, with a below-median market capitalization. This could imply less stability unless the company possesses unique technology or a market advantage that could lead to growth or acquisition.
6. Poor Return on Equity: The company’s return on equity has been below the median over the most recent four quarters compared to its peers. This indicates that the company’s management might not be effectively utilizing shareholders’ equity to generate profits.
7. Low Revenue Growth: The stock has exhibited below-median revenue growth over the past five years compared to its sector, which might suggest limitations in the company’s ability to expand its business.
8. Low Earnings Growth: The stock has shown below-median earnings growth over the past five years compared to its sector. This could be an indication of limited profitability growth potential.
9. Highly Leveraged: The company is in the bottom half in terms of debt-to-equity ratio compared to its peers, making it highly leveraged. This might indicate an aggressive growth strategy or increased risk.

STA Research (StockTargetAdvisor.com) is a independent Investment Research company that specializes in stock forecasting and analysis with integrated AI, based on our platform stocktargetadvisor.com, EST 2007.


