Best Stocks to Buy Now - Top AI Stock Picks Historic Performance
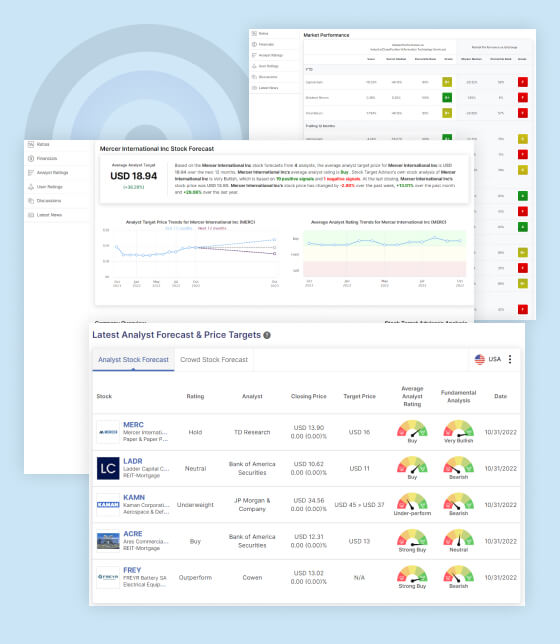
Our Top AI Stock Picks list includes stocks followed by at least 3 analysts, with favourable analyst coverage, positive Stock Target Advisor evaluation and upward price projections, analyzed by our proprietary AI engine. This list is not a personalized buy recommendation and should not be considered financial advice to buy or sell any securities.
Loading...
Frequently Asked Questions
Our top stock picks for today can be found on our Top Stocks page above. Stock Target Advisor's Top Picks are updated daily. Unlike other sites, we offer you a wide variety which you can sort and filter by Exchange, Sectors, Covering Analysts and Projecte Price Increase.
Our stock picks are determined by analyzing stocks that are followed by at least three analysts, have favorable analyst coverage, a positive evaluation from Stock Target Advisor, and show upward price projections.
A stock followed by multiple analysts indicates that there's significant interest and scrutiny from the financial community. It adds an extra layer of vetting and reduces the chances of bias or oversight.
"Favourable analyst coverage" means that a majority of the analysts tracking the stock have given it a "buy" or "strong buy" rating, indicating positive sentiment.
Stock Target Advisor uses a proprietary algorithm which evaluates tens of thousands of stocks every day based on a comprehensive analysis of financial metrics, recent earnings performance, market trends, and comparisons with industry peers. This analysis generates a stream of positive and negative signals which we aggregate into a simple to understand fundamental rating. Unlike other sites, our analysis is transparent and we list all the positive and negative signals on the detailed analysis page for each stock.
Our top stock picks list is updated daily to ensure our users have the most current and relevant information at their fingertips.
Yes, like all investments, there are inherent risks. Stock prices can be volatile and influenced by various external factors. While we provide well-researched picks, it's crucial to do your own due diligence and consult with financial professionals before making investment decisions.
We pride ourselves on the accuracy and relevance of our picks. Our past stock picks have shown a consistent record of positive performance, but past results do not guarantee future outcomes. You can view our historical performance by clicking on the Historic Performance link at the top of this page.
Yes, absolutely. You can subscribe to our premium or platimum service and enable notifications to receive daily alerts for our top stock picks directly to your inbox or mobile device.
There is no direct answer to this as even if a site provides you with a top stocks list they may not be fit for your risk tolerance or compaitble with your existing portolio. That is why we provide a comprehensive list of top stocks based on multiple criteria which you can filter based on your own preferrence. This list is just a starting point. You can then deep dive into each stock by going to its detailed analysis page to decide if it is a good addition for your portfolio.
Loading...


